The Oversight Simulator puts three published studies under one set of controls. You set delegation depth, reviewer capacity, verification coverage and an irreversibility tier, and the panels redraw from the lab's published numbers. It is a simulation from published coefficients, and every value it shows is listed with its source.
What it does
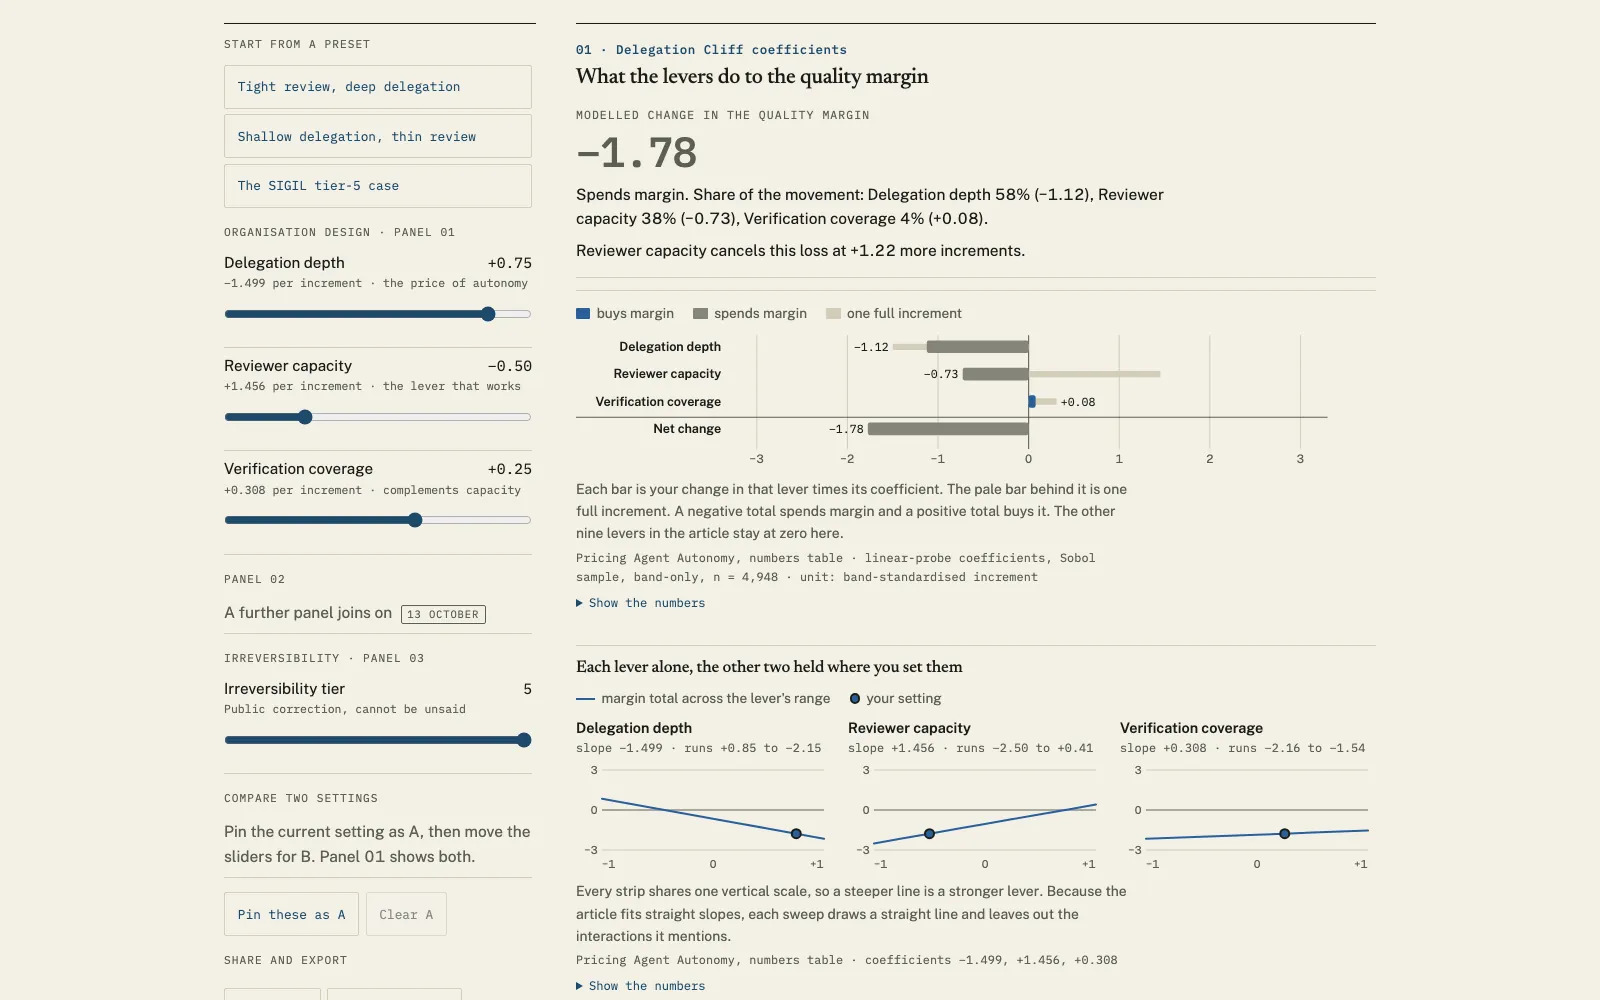
Move the organisation levers and the Delegation Cliff coefficients tell you how much quality margin you spend or buy. The reading counts from wherever you started, since the article prints no intercept. A strip of small multiples shows how far each lever alone can move the total.
At the audit desk, a reading budget and a diary length select one cell of the Trial Balance surface, and two bars show whether either auditor clears the paper's 0.80 bar. The SIGIL panel takes an irreversibility tier and reports how much of a worker's error a blocking reviewer could reach, from 93% on reversible invoices down to 1.4% on public corrections. Hover a row for the counts behind its share. A further panel joins on 13 October.
How to use it
Start from a preset or drag the sliders. Pin a setting as A to compare it against a second one, and the link you copy reopens the page on exactly those settings.
The scoreboard at the foot reads every setting back in plain words. It downloads as a PNG and the numbers as a CSV, sources included, and the page prints as a one-page briefing.
What it does not do
It gives no absolute margin, because the article prints no intercept, and it draws no intervals for the coefficients, because none are printed. The additive reading leaves out the interactions the article mentions, which is why every sensitivity line is straight.
Each panel computes from its own study alone. The lab has published no coefficient that maps reviewer capacity onto a SIGIL tier, so the page converts nothing between studies. The audit desk shows two of the paper's four arms.
Where the numbers come from
Panel 01 uses the twelve coefficients from Pricing Agent Autonomy (3 September 2026), with −1.499 for delegation depth, +1.456 for reviewer capacity and +0.308 for verification coverage, fitted on 4,948 cases. Panel 03 uses the SIGIL paper (10 September 2026) and its executive piece for four rows per tier: the task family, the share of errors that were wrongful approvals, the net value per decision, and how often review blocked wrongly, 30.1% at the top tier. The audit desk reads the Trial Balance surface (1 October 2026), with budgets from 200 to 12,800 tokens per audit and diaries from 1 to 16 requisitions. The preset sentences are computed at run time from these rows.
Open the tool
A read-me-first note opens on your first visit. A self-check of 44 tests runs in the console and its count shows in the footer. It runs in your browser and sends nothing anywhere.
Open the tool Full screen in a new tab Open with deep delegation at the top tier